


Line Plots Plotting Data software
Line Plots Plotting Data
Added: September 17, 2013 | Visits: 458
 plots a 3-D "line" with c-data as colorMakes a surface object and the colouring is controlled by the colormap.Example:v_start = [2 1 8]; % m/sg = 9.81; % m/(s^2)t_impact = 2*v_start(3)/g; % st = [0:t_impact/100:t_impact]'; % sx = v_start(1)*t; % my = v_start(2)*t; % mz = v_start(3)*t-1/2*g*t.^2;...
Platforms: Matlab
| License: Shareware | Cost: $0.00 USD | Size: 10 KB | Download (50): 3D colored line plot Download |
Added: June 11, 2013 | Visits: 320
plots a 2-D "line" with c-data as colorMakes a surface object and the colouring is controlled by the colormap.Examples:x = 0:0.1:2*pi;color_line(x,sin(x),sin(x))color_line(x,cos(x),cos(x),'*')
Platforms: Matlab
| License: Shareware | Cost: $0.00 USD | Size: 10 KB | Download (48): Colored line or scatter plot Download |
Added: August 08, 2013 | Visits: 296
plotAverage adds an average line into plotted data.By default, plotAverage- calculates the average along y (for given or estimated points along x)- plots errorbars with the standard error of the mean- discards outliers to calculate the robust average- plots the average line into the data's axes...
Platforms: Matlab
| License: Shareware | Cost: $0.00 USD | Size: 10 KB | Download (47): Plot average line Download |
Released: April 16, 2024
|
Added: April 24, 2024 | Visits: 764
 Aiseesoft FoneLab can recover lost/deleted messages, contacts, call history, calendar, notes, WhatsApp/Kik/Line/WeChat etc. data from iPhone/iPad/iPod directly or from iTunes/iCloud backup files. It supports all iOS portable devices like iPhone (the latest iPhone 15 series included), iPad, iPod...
Platforms: Windows, Windows 8, Windows 7
| License: Shareware | Cost: $26.90 USD | Size: 2.26 MB | Download (168): Aiseesoft FoneLab iPhone Data Recovery Download |
Released: June 21, 2012
|
Added: June 21, 2012 | Visits: 373
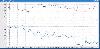 Creates interactive plots of data lines over a time scale. Automatic detection of input format and scale will result in instantaneous results without any need for configuration.
Platforms: Windows, Mac, Linux
| License: Freeware | Size: 21.33 KB | Download (46): Time Data Plotter Download |
Added: May 10, 2013 | Visits: 664
Graphist presents plots of data as GIF, JPEG, or PNG images. Though PHP is used by Graphist to produce the image, pages that use its images can be ordinary HTML. These images are added to a web page the same way as any image, such as a corporate logo or picture of your dog: an IMG tag. The tag's...
Platforms: Windows, Mac, *nix, PHP, BSD Solaris
| License: Freeware | Download (69): Graphist Download |
Released: December 21, 2012
|
Added: December 21, 2012 | Visits: 258
DbViz produces plots of data contained in MySQL databases. Data can be viewed by looking at line graphs, xy scatter plots, and bar graphs. This greatly simplifies data analysis.
Platforms: Windows, Mac, Linux
| License: Freeware | Size: 1.78 MB | Download (48): DbViz Download |
Added: August 19, 2013 | Visits: 461
[coef, RSquared]=plotfit(x,y,polyorder)A simple function that accepts x,y data pairs in in the vectors "x" and "y", fits it to a polynomial of order "polyorder", plots the data and the fit, and displays the fit coefficients and the goodness-of-fit measure R-squared in the upper left corner of the...
Platforms: Matlab
| License: Freeware | Size: 10 KB | Download (45): plotfit Download |
Added: April 17, 2013 | Visits: 613
The GUI application plots VLE data of ethanol-water mixture at various pressures. Both Txy and xy diagrams can be plotted at the pressure value specified by the user. The Wilson model allows the program to take into account the deviation from ideal behavior in the liquid phase. User should enter...
Platforms: Matlab
| License: Freeware | Size: 10 KB | Download (47): Isobaric vapor-liquid diagram using GUI Download |
Added: July 25, 2013 | Visits: 332
multiplot - 2D-line plots on several axes with common x-axismultiplot(XDATA,YDATA,'PropertyName',PropertyValue,...) plots the datastored in the cell arrays XDATA and YDATA in several subplots with a commonx-axis. multiplot also links all generated axes in order to synchronize thezoom along the...
Platforms: Matlab
| License: Shareware | Cost: $0.00 USD | Size: 10 KB | Download (45): MULTIPLOT2 - Multiplot version for version prior to R2007a (do not use inputParser) Download |
Added: May 29, 2013 | Visits: 296
multiplot - 2D-line plots on several axes with common x-axismultiplot(XDATA,YDATA,'PropertyName',PropertyValue,...) plots the datastored in the cell arrays XDATA and YDATA in several subplots with a commonx-axis. multiplot also links all generated axes in order to synchronize thezoom along the...
Platforms: Matlab
| License: Shareware | Cost: $0.00 USD | Size: 10 KB | Download (42): MULTIPLOTc Download |
Added: April 23, 2013 | Visits: 290
multiplot - 2D-line plots on several axes with common x-axismultiplot(XDATA,YDATA,'PropertyName',PropertyValue,...) plots the datastored in the cell arrays XDATA and YDATA in several subplots with a commonx-axis. multiplot also links all generated axes in order to synchronize thezoom along the...
Platforms: Matlab
| License: Shareware | Cost: $0.00 USD | Size: 10 KB | Download (46): Multiple Plot Download |
Added: July 13, 2013 | Visits: 489
Graphist presents plots of data as GIF, JPEG, or PNG images. Though PHP is used by Graphist to produce the image, pages that use its images can be ordinary HTML.These images are added to a web page the same way as any image, such as a corporate logo or picture of your dog: an IMG tag.The tag's...
Platforms: PHP
| License: Freeware | Size: 20.48 KB | Download (49): Graphist Script Download |
Added: May 02, 2013 | Visits: 490
Graphist presents plots of data as GIF, JPEG, or PNG images. Though PHP is used by Graphist to produce the image, pages that use its images can be ordinary HTML.These images are added to a web page the same way as any image, such as a corporate logo or picture of your dog: an IMG tag.The tag's...
Platforms: PHP
| License: Freeware | Size: 10 KB | Download (48): Graphist for Scripts Download |
Added: August 07, 2013 | Visits: 247
qmatplot is a gnuplot-like tool for plotting data sets in either two or three dimensions. It can plot many types of 2d plots, including pixmaps and contours, and 3d surfaces. It offers a full WYSIWYG mode with multiple objects on a single page. See the sc
Platforms: *nix
| License: Freeware | Size: 1.09 MB | Download (36): qmatplot Download |
Released: December 09, 2012
|
Added: December 09, 2012 | Visits: 436
 Command line utility Exports data from any table via ODBC into text file . Great performance - thousands of records per second. Usage example: table2text.exe DSN=odbcdsn;USER=username;PASSWORD=password;TABLE=table_name;FILE=c:test.csv
Platforms: Windows
| License: Freeware | Size: 1003.52 KB | Download (55): Table2Text Download |
Added: June 11, 2013 | Visits: 317
Myplotyy plots different data sets with a common x-axis but using individual y-axes in one figure.The properties of every curve (y-axis) can be individually adjusted, such as linear or logarithmic scale, normal or reverse scale, confidence intervals, colors, curve labeling, ...See screenshot and...
Platforms: Matlab
| License: Shareware | Cost: $0.00 USD | Size: 30.72 KB | Download (39): Myplotyy Download |
Added: August 22, 2013 | Visits: 324
Plots each data point as a box, and puts each box on the graph in such a way that no boxes overlap. By default produces a standalone plot in a new figure window, but can plot into specified axes as well. See the comments in the function help for more detail.
Platforms: Matlab
| License: Shareware | Cost: $0.00 USD | Size: 10 KB | Download (41): Generate a Dotplot Download |
Added: September 03, 2013 | Visits: 478
SPHERE3D plots 3D data on a spherical surface. Useful particularly in metrology of spherical surfaces, spherical wavefronts and wavefields.SPHERE3D(Zin,theta_min,theta_max,phi_min,phi_max,Rho,meshscale)plots the 3D profile Zin as a mesh plot on a spherical surface of radius Rho, between...
Platforms: Matlab
| License: Shareware | Cost: $0.00 USD | Size: 542.72 KB | Download (47): 3D Plot on a Spherical Surface Download |
Added: August 06, 2013 | Visits: 413
Data::LineBuffer is a Perl module that provides a very rudimentary input push back facility. It provides a layer between the input source and the calling routine which allows data to be pushed back onto the input source for retrieval, as a last in, first out, stack. It is only concerned with...
Platforms: *nix
| License: Freeware | Size: 10.24 KB | Download (33): Data::LineBuffer for Linux Download |