


Javascript Contour Graph Plots software
Javascript Contour Graph Plots
Released: September 25, 2012
|
Added: September 25, 2012 | Visits: 417
 JavaScript Object Graph for Java is a library designed to simplify working with JSON objects in Java code.
Platforms: Windows, Mac, Linux
| License: Freeware | Size: 1.27 MB | Download (50): JavaScript Object Graph Download |
Added: December 03, 2013 | Visits: 555
sarface is a user-interface to the sysstat/sar database which inputs data from sar and plots to a live X11 graph via gnuplot. It mimics the cmd-line options from sar but can cross-plot any two or more stats and apply simple mathematical functions them.
Platforms: *nix
| License: Freeware | Size: 327.68 KB | Download (42): sarface Download |
Added: August 05, 2013 | Visits: 378
% Reliable and extremely fast kernel density estimator for one-dimensional data;% Gaussian kernel is assumed and the bandwidth is chosen automatically;% Unlike many other implementations, this one is immune to problems% caused by multimodal densities with widely separated modes (see example)....
Platforms: Matlab
| License: Shareware | Cost: $0.00 USD | Size: 10 KB | Download (42): Kernel Density Estimator Download |
Released: August 01, 2012
|
Added: August 01, 2012 | Visits: 332
 Swingpro is a combination software/wireless swing chronograph that can measure swing speed (MPH) and reaction time (hundreds of seconds). Increasing a players swing speed allows for more time to wait-on-a-pitch before you swing. This enables batters to observing the pitch, allowing them to choose...
Platforms: Windows
| License: Shareware | Cost: $49.99 USD | Size: 10.98 MB | Download (401): Swingpro Download |
Added: September 04, 2013 | Visits: 462
As of now, matlab2tikz does not support the conversion of all possible MATLAB figures. Most notably, only a few simple 3D plots are supported.More support will likely be included in one of the next versions.If you have a nice 2D plot, matlab2tikz might just do what you need. Disregarding text...
Platforms: Matlab
| License: Shareware | Cost: $0.00 USD | Size: 51.2 KB | Download (49): matlab2tikz Download |
Added: November 18, 2013 | Visits: 584
The Blackbody Radiation: Frequency and Wavelength model simulates the blackbody radiation curves of Planck both as a function of frequency and as a function of wavelength to allow for comparison of the two functions. The Planck radiation law can be derived both as a function of frequency and as a...
Platforms: Mac
| License: Freeware | Size: 1.08 MB | Download (35): Blackbody Radiation: Frequency and Wavelength Download |
Added: August 05, 2013 | Visits: 512
javascript Graph-it helps you to create graphs out of raw data.You must just input the name/value pairs of the involved graph elements, and leave the rest to the script.The values can be either absolute or percentage (using two versions of script). Graph-it allows you to render more than one...
Platforms: JavaScript
| License: Freeware | Size: 102.4 KB | Download (51): javascript Graph-it Script Download |
Added: April 22, 2013 | Visits: 360
Plots contour points onto given image. The contour vector is assumed to be in the domain as defined in ToPolar.m (another file submitted by me)
Platforms: Matlab
| License: Shareware | Cost: $0.00 USD | Size: 10 KB | Download (47): Contour Plot onto Image Download |
Added: February 18, 2006 | Visits: 3.062
 Add Powerful reporting features to your Web / Intranet pages and applications.
With the advanced graphing package you will be quickly adding impressive dynamic charting capabilities bringing your data alive !
Powerful components provide both client & server side solutions for adding graphs &...
Add Powerful reporting features to your Web / Intranet pages and applications.
With the advanced graphing package you will be quickly adding impressive dynamic charting capabilities bringing your data alive !
Powerful components provide both client & server side solutions for adding graphs &...
Platforms: Windows, Mac, *nix, Windows CE
| License: Shareware | Cost: $199.95 USD | Size: 214 KB | Download (527): Advanced Graph and Chart Collection Download |
Released: May 05, 2004
|
Added: January 18, 2006 | Visits: 3.010
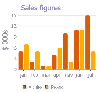
 This 3D Stacked Vertical Bar Graph provides both a client and server side solution for the incorporation of bar graphs into web pages. It provides versatile components so that web authors and Java developers can easily build and publish dynamic and interactive bar graphs.
We have built in many...
This 3D Stacked Vertical Bar Graph provides both a client and server side solution for the incorporation of bar graphs into web pages. It provides versatile components so that web authors and Java developers can easily build and publish dynamic and interactive bar graphs.
We have built in many...
Platforms: Windows, Mac, *nix
| License: Shareware | Cost: $99.95 USD | Size: 277 KB | Download (451): 3D Stacked Vertical Bar Graph Software Download |
Released: June 06, 2004
|
Added: January 24, 2006 | Visits: 3.189
 The "xyExtract" software is used for to extract data from a 2D graph (orthogonal and nonorthogonal axes) contained in a graphic file (scanned, PDF document or in a some file like gif, jpg, etc). The graphic file must be saved in a bitmap file. Then, the "xyExtract" converts the graph back to xy...
| License: Shareware | Cost: $25.00 USD | Size: 450 KB | Download (771): xyExtract Graph Digitizer Download |
Added: August 20, 2008 | Visits: 1.125
 Graph Digitizer Scout automatically converts hard-copy graphs, oscillograms, charts, plots, into X,Y. Different recognition methods including manual correction mode. Data can be exported to Excel, CSV format and other applications.
Platforms: Windows
| License: Demo | Cost: $35.00 USD | Size: 5.21 MB | Download (126): Graph Digitizer Scout Download |
Added: August 14, 2008 | Visits: 2.473
 Graph plotter program plots 2D graphs from complex equations. The application comprises algebraic, trigonometric, hyperbolic and transcendental functions. EqPlot can be used to verify the results of nonlinear regression analysis program. Graphically Review Equations: Equation graph plotter gives...
Platforms: Windows
| License: Shareware | Cost: $15.00 USD | Size: 1.91 MB | Download (286): Equation graph plotter - EqPlot Download |
Added: September 03, 2010 | Visits: 2.140
SVG::Graph is a Perl module to visualize your data in Scalable Vector Graphics (SVG) format. SYNOPSIS use SVG::Graph; use SVG::Graph::Data; use SVG::Graph::Data::Datum; #create a new SVG document to plot in... my $graph = SVG::Graph->new(width=>600,height=>600,margin=>30); #and create...
Platforms: *nix
| License: Freeware | Size: 88.06 KB | Download (151): SVG::Graph Download |
Added: March 15, 2010 | Visits: 1.916
PHP Advanced Graph and Chart Collection software provides a very easy way to embed dynamically-generated graphs and charts into PHP applications and HTML Web pages. The Graphing components provide various solutions for the incorporation of graphs and charts into Web/intranet pages and...
Platforms: *nix
| License: Shareware | Cost: $195.00 USD | Size: 1.5 MB | Download (108): PHP Advanced Graph and Chart Collection Download |
Released: April 28, 2014
|
Added: June 04, 2014 | Visits: 1.127
 TeeChart for Javascript is written in 100% Javascript and is designed for use across multiple different browser types supporting the HTML5 Canvas. It uses the HTML5 Canvas element to render chart contents.
TeeChart for Javascript is available as a standalone product and as an export format...
TeeChart for Javascript is written in 100% Javascript and is designed for use across multiple different browser types supporting the HTML5 Canvas. It uses the HTML5 Canvas element to render chart contents.
TeeChart for Javascript is available as a standalone product and as an export format...
Platforms: Mac, *nix, Windows 8, Windows Phone, Windows 7, Windows, iOS, Android, BlackBerry
| License: Shareware | Cost: $129.00 USD | Size: 1.73 MB | Download (110): TeeChart for Javascript Download |
Released: April 17, 2012
|
Added: July 03, 2012 | Visits: 1.434
 The smartest CSS, HTML and JavaScript IDE for Web Development is at your fingertips. Navigate through files easily. Use relevant autocompletion for everything in your code. Get notified about code problems on the fly. Complicated language mixtures with HTML markup or SQL inside a JavaScript?...
Platforms: Windows, Mac, *nix, Java
| License: Shareware | Cost: $49.00 USD | Size: 107.12 MB | Download (92): JavaScript IDE WebStorm Download |
Released: February 13, 2016
|
Added: March 06, 2016 | Visits: 810
 JsDiagram is a flow diagramming JavaScript / HTML 5 Canvas library for web applications. It helps you create and present flowcharts, workflow and process diagrams, organizational and relationship charts, network and hierarchy drawings, graphs and trees. The library includes more than 100 stock...
Platforms: Windows, Mac, *nix, Windows 7, Windows Server, Other
| License: Commercial | Cost: $400.00 USD | Size: 8.37 MB | Download (82): MindFusion.Diagramming for JavaScript Download |
Added: April 19, 2013 | Visits: 969
The 2D / 3D Area Graph provides both a client and server side solution for the incorporation of area graphs and charts into web pages. It provides versatile components so that web authors and Java developers can easily build and publish dynamic and interactive area charts.Both the applet and...
Platforms: Java
| License: Shareware | Cost: $49.00 USD | Size: 358.4 KB | Download (44): 2D / 3D Area Graph and Charts Download |
Added: June 12, 2013 | Visits: 870
The 3D Vertical Bar Graph software provides both a client and server side solution for the incorporation of bar graphs and charts into web pages.It provides versatile components so that web authors and Java developers can easily build and publish dynamic and interactive bar charts.Both the applet...
Platforms: Java
| License: Shareware | Cost: $49.00 USD | Size: 358.4 KB | Download (44): 2D / 3D Vertical Bar Graph and Charts Download |