


Graphs Plotting software
Graphs Plotting
Released: November 15, 2012
|
Added: November 15, 2012 | Visits: 387
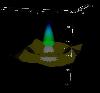
 Periscope is a 3D plotting library written in C++ on top of VTK. It provides an abstract interface for creating 3D plots.
Platforms: Windows, Mac, BSD, Linux
| License: Freeware | Size: 369.29 KB | Download (58): Periscope 3D Plotting Library Download |
Released: July 10, 2012
|
Added: July 10, 2012 | Visits: 419
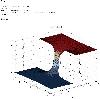
 Pyllar is a 3D plotting library for the Python programming language. It uses the Visualization Toolkit (VTK) and PyNum library provide high quality 3D plots for science and engineering.
Platforms: Windows, Mac, Linux
| License: Freeware | Size: 490.86 KB | Download (48): Pyllar Plotting Library Download |
Released: June 27, 2012
|
Added: June 27, 2012 | Visits: 412
 The Visualization of Protein-Ligand Graphs (VPLG) software package computes and visualizes protein graphs. It works on the super-secondary structure level and uses the atom coordinates from PDB files and the SSE assignments of the DSSP algorithm.
Platforms: Windows, Mac, BSD, Linux
| License: Freeware | Size: 6.6 MB | Download (45): Visualization of Protein-Ligand Graphs Download |
Added: May 10, 2013 | Visits: 276
The os.path.walk routine that ships with the python standard library is limited to traversing the file system tree. This script allows you to realize a generic traversal for arbitrary (directed) graphs with support for recursion limits.
Platforms: Windows, Mac, *nix, Python, BSD Solaris
| License: Freeware | Download (50): Lazy Traversal of Directed Graphs Download |
Added: April 05, 2013 | Visits: 507
This GUI Signal Processing tool will help us to process signal from any picture file.This tool will help us to perform signal processing operations at very friendly GUI menu. The menu is self explanatory.How to start1. Extract Zip file to desired location2. Open MATLAB3. Open the Tool and press...
Platforms: Matlab
| License: Freeware | Size: 122.88 KB | Download (43): Signal Processor for Graphs (Pictures) update 1 Download |
Added: May 08, 2013 | Visits: 456
mPlot is an enhanced plotting engine that extends the basic plotting functionality delivered with Matlab. The purpose of mPlot is to consolidate daily plotting and formatting tasks into a single, easy-to-use object. Provided within the class are both high-level and low-level functionality. The...
Platforms: Matlab
| License: Freeware | Size: 10 KB | Download (41): mPlot - Enhanced Plotting Engine Download |
Added: September 14, 2013 | Visits: 358
main executing reference usage: usage_directAndTarOutputs.mThe objective is to illustrate status tracking and collation of inputs and results. The package is tar'red in preparation for sending, such as in (http://www.mathworks.co.uk/matlabcentral/f...ile-by-emailing).sub-processes:usage_savefigs...
Platforms: Matlab
| License: Shareware | Cost: $0.00 USD | Size: 51.2 KB | Download (44): Track, Collect And Tar Inputs And Outputs Download |
Added: September 11, 2013 | Visits: 468
MATLAB (R) tool for plotting Rosin-Rammler Diagram - a tool with GUI designed for creating Rosin-Ramler Diagrams, calculating Rosin-Rammler distribution parameters and size distribution values based on experimental data. It supports loading and saving experimental size distribution data sets as...
Platforms: Matlab
| License: Shareware | Cost: $0.00 USD | Size: 460.8 KB | Download (43): Rosin-Rammler Diagram plotting tool Download |
Added: April 25, 2013 | Visits: 432
A very easy symbolic method for reduction of block diagrams or signal flow graphs with Matlab is presented. The method can be applied to every kind of diagram and it is possible to obtain in one stage all transfer functions for a given input. The method is validated with some examples, including...
Platforms: Matlab
| License: Shareware | Cost: $0.00 USD | Size: 122.88 KB | Download (44): Symbolic reduction of block diagrams and signal flow graphs Download |
Added: July 08, 2013 | Visits: 414
The note describes a simple m-file for digitizing graphs in the form of bitmap images using the Matlab ginput mouse pointer.Axes are allowed to be skewed, as well as linear and/or logarithmic.
Platforms: Matlab
| License: Shareware | Cost: $0.00 USD | Size: 61.44 KB | Download (48): Digitizing Graphs Download |
Added: March 26, 2013 | Visits: 482
The SumProductLab provides a set of basic factor nodes for building up a factor graph. One can try out ideas by instantiating the necessary constraint nodes, connecting them up, and giving some evidence. The sum-product (or belief propagation) algorithm will compute the message to each node in...
Platforms: Matlab
| License: Shareware | Cost: $0.00 USD | Size: 829.44 KB | Download (45): SumProductLab for Factor Graphs Download |
Added: June 30, 2013 | Visits: 277
Convenience function for plotting spreadsheets specifying several variables and also conditionsGeneral-purpose script for plotting spreadsheets. You can plot multiple variables, select the plotting range and also the plotting conditions: xlsplot( [xls file], [x variable], [y1 variable], [y2...
Platforms: Matlab
| License: Shareware | Cost: $0.00 USD | Size: 10 KB | Download (47): plotting a .xls spreadsheet Download |
Added: June 29, 2013 | Visits: 355
For analysing measurements (or simulations) it is often necessary to plot different graphs from an array of data. Some graphs have one line, other have more.PLOTMAT is a function to do this. Given an array of data, and an array for which columns have to be plotted in which graphs, the graphs are...
Platforms: Matlab
| License: Shareware | Cost: $0.00 USD | Size: 10 KB | Download (39): Plot different graphs at once Download |
Added: September 22, 2013 | Visits: 614
The Function Plotting and Data Fitting Model allows you to create customizable plots to interactively explore the properties of up to three functions at a time. When you enter a function, adjustable parameters are automatically recognized, and sliders are created to vary the values of these...
Platforms: Mac
| License: Freeware | Size: 1.41 MB | Download (42): Function Plotting and Data Fitting Model Download |
Added: October 14, 2013 | Visits: 393
PerfLog is an open source amd Pytghon based tool which will allow you to analyze web server logs. NOTE: The logs you want to analyze using PerfLog must be in the W3C Extended Log File Format. Here are some key features of "PerfLog": ?*A* Produces metrics and graphs from web logs (W3C Extended...
Platforms: Mac
| License: Freeware | Size: 10.24 KB | Download (44): PerfLog Download |
Released: December 01, 2013
|
Added: January 15, 2014 | Visits: 868
 STIMATH is a high-level tool for mathematics, linear algebra, plotting and expression evaluation that can be used from any programming environment or even from a command line interface. It is an executable that takes a single argument, the name of a text file containing a series of MATLAB style...
Platforms: Windows 7
| License: Commercial | Cost: $50.00 USD | Size: 292.97 KB | Download (46): STIMATH Download |
Released: October 01, 2002
|
Added: June 20, 2006 | Visits: 5.798
 DigitizeIt digitizes scanned graphs. Graphs can be loaded in nearly all common image formats (incl. gif,tiff,jpeg,bmp,png) or pasted from the clipboard . Digitizing of line and scatter plots occurs automatically, manual digitizing is also possible. Data values are transformed to a specified axes...
Platforms: Windows, Mac, *nix
| License: Shareware | Cost: $39.00 USD | Size: 8.61 MB | Download (684): DigitizeIt Download |
Added: April 04, 2006 | Visits: 7.191
TaskMeter lets you put your CPU usage graph right on your taskbar. You can also measure a wide variety of other things, including disk access, network access, context switches, memory usage, and many more. Anything you can monitor in performance monitor (perfmon), you can monitor in TaskMeter....
Platforms: Windows
| License: Shareware | Cost: $15.00 USD | Size: 1000 KB | Download (401): TaskMeter Download |
Released: January 10, 2002
|
Added: May 10, 2006 | Visits: 8.710
 3DMath Explorer is a computer program that pilots 2D and 3D graphs of mathematical functions and curves in unlimited graphing space. It has many useful feature such as 3D curve ploting in real time, perspective drawing, graph scaling (zooming), active graph rotation, fogging effect, cubic draw,...
Platforms: Windows
| License: Shareware | Cost: $45.00 USD | Size: 2.33 MB | Download (610): 3DMath Explorer Download |
Added: August 22, 2006 | Visits: 2.914
 GraphSight Junior is an easy to use freeware handy 2D math-graphing program. It was originally designed to help students and teachers satisfy their day-after-day math plotting needs. It makes it easy to plot and explore common Y(X) = F(X) Cartesian graphs, set text labels on the coordinate plane,...
Platforms: Windows
| License: Freeware | Size: 393 KB | Download (720): GraphSight Junior Download |