


Graph Plotter Linux software
Graph Plotter Linux
Added: August 22, 2008 | Visits: 1.423
 Graph Plotter is a powerful tool which can help you to plot and analyze different types of graphs. It is easy-to-use and user-friendly. In addition it can find asymptotes of function, break points, extremums and calculate limit, define integral, derivative of function and more.
Platforms: Windows
| License: Shareware | Cost: $25.00 USD | Size: 1.69 MB | Download (158): Graph Plotter Download |
Added: August 14, 2008 | Visits: 2.475
 Graph plotter program plots 2D graphs from complex equations. The application comprises algebraic, trigonometric, hyperbolic and transcendental functions. EqPlot can be used to verify the results of nonlinear regression analysis program. Graphically Review Equations: Equation graph plotter gives...
Platforms: Windows
| License: Shareware | Cost: $15.00 USD | Size: 1.91 MB | Download (286): Equation graph plotter - EqPlot Download |
Released: August 11, 2012
|
Added: August 11, 2012 | Visits: 570
 Graph plotter program plots 2D graphs from complex equations. The application comprises algebraic, trigonometric, hyperbolic and transcendental functions. EqPlot can be used to verify the results of nonlinear regression analysis program. Graphically Review Equations: Equation graph plotter gives...
Platforms: Windows, Other
| License: Shareware | Cost: $15.00 USD | Size: 3.17 MB | Download (523): Equation Plotter - EqPlot Download |
Added: January 17, 2010 | Visits: 1.442
openPlaG is an online function graph plotter, written in PHP. This application can compute and plot a very high amount of functions, including many probability functions and is fairly good configurable. Instructions: To run the program, youll need access to a web server with PHP 4 or 5 and...
Platforms: *nix
| License: Freeware | Size: 24.58 KB | Download (104): openPlaG Download |
Added: January 16, 2010 | Visits: 995
Lybniz project is a simple function graph plotter in Python on GTK. Lybniz allows to plot up to three functions on one graph. It needs no installation - simply one Python script..
Platforms: *nix
| License: Freeware | Size: 12.29 KB | Download (127): Lybniz Download |
Added: August 06, 2008 | Visits: 1.281
Graph plotter program plots 2D graphs from complex equations. The application comprises algebraic, trigonometric, hyperbolic and transcendental functions. EqPlot can be used to verify the results of nonlinear regression analysis program. Graphically Review Equations: Equation graph plotter gives...
Platforms: Windows
| License: Shareware | Cost: $15.00 USD | Size: 1.95 KB | Download (109): Equation Plotter - EqPlot Download |
Added: August 26, 2013 | Visits: 206
python-graph is a library for working with graphs in Python. This software provides *a suitable data structure for representing graphs and a whole set of important algorithms. The code is appropriately documented and API reference is generated automatically by epydoc. Comments, bug reports...
Platforms: *nix
| License: Shareware | Cost: $0.00 USD | Size: 10.24 KB | Download (38): python-graph For Linux Download |
Added: August 26, 2008 | Visits: 2.355
 A real-time graph plotter. While your application is computing and logging results to a CSV file using the LiveGraph Writer API, the plotter lets you visualise and monitor the results live - by instantly plotting charts and graphs of the data. A concise user interface allows to manage 100s of...
Platforms: Windows
| License: Freeware | Size: 889 KB | Download (532): LiveGraph Download |
Released: June 16, 2012
|
Added: June 16, 2012 | Visits: 508
 FX Graph software was created to be a simple, easy to use, but powerful, graphing program. Most graphing packages offer powerful features but they are difficult to learn, difficult to teach and difficult to use. Many schools spend more time teaching students how to use the program rather than...
Platforms: Windows
| License: Shareware | Cost: $43.48 USD | Size: 4.2 MB | Download (515): FX Graph Download |
Released: September 10, 2012
|
Added: September 10, 2012 | Visits: 423
 Veusz is a GUI scientific plotting and graphing package. It is designed to produce publication-ready Postscript or PDF output. SVG, EMF and bitmap export formats are also supported. The program runs under Unix/Linux, Windows or Mac OS X, and binaries are provided. Data can be read from text, CSV...
Platforms: Linux
| License: Freeware | Size: 10.2 MB | Download (451): Veusz for Linux Download |
Added: August 12, 2013 | Visits: 416
FMFS stands for FMFS may free students, it is a small collection of programs related to mathematics. It consists of a 2D graph plotter, a 3D graph plotter, a evaluator for basic mathematics expressions at high precision and a few more tools. FMFS also provide a small programming language for...
Platforms: Mac
| License: Freeware | Size: 245.76 KB | Download (40): FMFS Download |
Added: June 13, 2010 | Visits: 1.079
xd3d is a simple scientific visualization tool designed to be easy to learn. It can plot 2d and 3d meshes, with shadowing, contour plots, vector fields, iso-contour (3d), as well as 3d surfaces z=f(x,y) defined by an algebraic expression or a cloud of points. It generates high quality vector...
Platforms: *nix
| License: Freeware | Size: 532.48 KB | Download (136): xd3d Download |
Released: August 08, 2012
|
Added: August 08, 2012 | Visits: 472
 Veusz is a GUI scientific plotting and graphing package. It is designed to produce publication-ready Postscript or PDF output. SVG, EMF and bitmap export formats are also supported. The program runs under Unix/Linux, Windows or Mac OS X, and binaries are provided. Data can be read from text, CSV...
Platforms: Mac
| License: Freeware | Size: 10.2 MB | Download (432): Veusz for Mac OS X Download |
Added: August 13, 2008 | Visits: 4.069
Diagram Designer is a simple, Open Source, vector graphics editor for creating flowcharts and diagrams. Features customizable template object palette, import/export WMF, EMF, BMP, JPEG, PNG, MNG, and PCX images. Simple graph plotter to plot mathematical expressions. Advanced "pocket" calculator...
Platforms: Windows
| License: Freeware | Size: 1.3 MB | Download (845): Diagram Designer Download |
Added: January 25, 2010 | Visits: 1.817
MI-SUGAR is a lightweight electrical circuit analysis environment which uses the free simulators SPICE and Gnucap. You can create analog circuits using the schematic entry tool or the netlist editor, then run the simulation and analyse the results in the graph plotter.
Platforms: Mac
| License: Freeware | Download (302): MI-SUGAR Download |
Released: October 02, 2012
|
Added: October 02, 2012 | Visits: 369
 JSynoptic renders information graphically. It can be used as a simple graph plotter, or as a complex run-time monitoring environment. The user sets up shapes (like plots) on graphical pages, and uses data sources (ex: ASCII file) to render information.
Platforms: Windows, Mac, Solaris, Linux
| License: Freeware | Size: 20.06 MB | Download (44): JSynoptic - A graphical sheet editor Download |
Added: August 14, 2013 | Visits: 355
It can compute and plot a very high amount of functions, including many probability functions and is fairly good configurable.A maximum number of three graphs can be displayed in one image.InstallationUpload the files to the webserver and point your browser to the location of openPlaG.html
Platforms: PHP
| License: Freeware | Size: 51.2 KB | Download (48): openPlaG for Scripts Download |
Added: February 27, 2010 | Visits: 1.536
The Linux Duracell CPU load monitor is a program that drives a Duracell or Energizer on-battery tester to display the CPU load of a system. It can be easily adapted to display other things that can use a slow bar graph kind of display that varies between 0% and 100%. Instructions to hack a...
Platforms: *nix
| License: Freeware | Size: 174.08 KB | Download (112): Linux Duracell CPU load monitor Download |
Added: April 16, 2010 | Visits: 1.049
Scientific Linux is a Linux release put together by various labs and universities around the world. Scientific Linuxs primary purpose is to reduce duplicated effort of the labs, and to have a common install base for the various experimentors. The base Scientific Linux distribution is basically...
Platforms: *nix
| License: Freeware | Size: 608.3 MB | Download (96): Scientific Linux Download |
Added: June 24, 2013 | Visits: 387
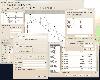
RLPlot is is a plotting program to create high quality graphs from data. Based on values stored in a spreadsheet several menus help you to create graphs of your choice. The Graphs are displayed as you get them (wysiwyg). Double click any element of the graph (or a single click with the right...
Platforms: *nix
| License: Freeware | Size: 593.92 KB | Download (36): RLPlot for Linux Download |