


Excel Contour Plot Scatter Plot software
Excel Contour Plot Scatter Plot
Added: May 15, 2013 | Visits: 430
 Like Matlab's scatter command, lscatter produces a scatter plot. Unlike scatter, it allows you to also use a vector of labels that are used instead of the usual uniform markers. lscatter(x,y,l)generates a scatter plot where label{i} is placed at the coordinate (x(i),y(i)), for all i.The program...
Platforms: Matlab
| License: Shareware | Cost: $0.00 USD | Size: 10 KB | Download (43): lscatter : scatter plot with labels instead of markers Download |
Added: January 22, 2010 | Visits: 1.649
Chart::Plot is a Perl module to plot two dimensional data in an image. SYNOPSIS use Chart::Plot; my $img = Chart::Plot->new(); my $anotherImg = Chart::Plot->new ($image_width, $image_height); $img->setData (@dataset) or die( $img->error() ); $img->setData (@xdataset, @ydataset);...
Platforms: *nix
| License: Freeware | Size: 15.36 KB | Download (116): Chart::Plot Download |
Added: April 12, 2013 | Visits: 613
Syntax: plotdata; plotdata(hPlotFig); plotdata(figureName,sheetName,xdata,ydata, xAxisName,yHeaders,...); [hDataFig, hSpreadsheet] = plotdata(...); PLOTDATA(hPlotFig) scans the supplied figure handle for any plot axes; for each plot axes found, a new spreadsheet is created with the plot data...
Platforms: Matlab
| License: Freeware | Size: 40.96 KB | Download (46): PlotData - display plot raw-data in data-tables Download |
Added: March 22, 2006 | Visits: 3.131
Plot Observer is an AutoCAD add-on utility that silently records all print/plot activity in AutoCAD. Plot Observer records billing information, page size/sqaure footage, plotter name, and user information for each print/plot run in AutoCAD. Plot Observer records data in a central log file for...
Platforms: Windows
| License: Shareware | Cost: $120.00 USD | Size: 3.32 MB | Download (169): Plot Observer Download |
Added: January 09, 2010 | Visits: 2.547
Chart::Plot::Canvas is a Perl module to plot two dimensional data in an Tk Canvas. SYNOPSIS use Chart::Plot::Canvas; my $img = Chart::Plot::Canvas->new(); my $anotherImg = Chart::Plot::Canvas->new ($image_width, $image_height); $img->setData (@dataset) or die( $img->error() );...
Platforms: *nix
| License: Freeware | Size: 5.12 KB | Download (162): Chart::Plot::Canvas Download |
Released: August 23, 2012
|
Added: August 23, 2012 | Visits: 701
Function Plot 2D is a small, simple, Java based application specially designed to help you create function plots.
Function Plot 2D lets you create a 2D plot, all you need to do is give an input function.
for WindowsAll
Platforms: Windows
| License: Freeware | Download (443): Function Plot 2D Download |
Released: August 23, 2012
|
Added: August 23, 2012 | Visits: 746
Function Plot 2D with Sections is a small, simple, Java based application specially designed to help you create function plots.
Function Plot 2D lets you create a 2D plot, all you need to do is give an input function.
for WindowsAll
Platforms: Windows
| License: Freeware | Download (449): Function Plot 2D with Sections Download |
Released: July 12, 2012
|
Added: July 12, 2012 | Visits: 432
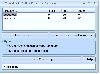 Plot multiple functions in MS Excel. Excel 2000 or higher required.
Platforms: Windows
| License: Shareware | Cost: $19.99 USD | Size: 769 KB | Download (508): Excel Graph Multiple Equations Software Download |
Added: August 13, 2013 | Visits: 575
This function plot in the same figure the center trajectory and attitude of an aircraft. See the figure to understand better.The version 2.0, extend the functionality of version 1. In this version there are much more body models [for example the tomcat (see the figure), the shuttle, the mig,...
Platforms: Matlab
| License: Freeware | Size: 1.74 MB | Download (43): Trajectory and Attitude Plot Version 2 Download |
Added: June 17, 2013 | Visits: 312
Give a dot plot for one data group. It could rerun the function by changing the 'data' and 'groupNum' for multi-group. It should run the function one times for each group, and they will show in the same diagram. The dot plot could also combine with box plot. Syntax dotPlot_xtr( data )...
Platforms: Matlab
| License: Shareware | Cost: $0.00 USD | Size: 10 KB | Download (43): Dot plot rather than scatter plot Download |
Added: March 26, 2013 | Visits: 311
Color Scatter Plot for random data point visualization. It mimics a continuous 2D probability distribution.coldotplot(x,y,s0,Ad) creates at scatterplot with dots of sizes that correspond to their density in the swarm of points. The larger dots will also have a more "hot" color in the dense...
Platforms: Matlab
| License: Shareware | Cost: $0.00 USD | Size: 10 KB | Download (39): color dot plot Download |
Added: May 22, 2013 | Visits: 487
"Plot to Bitmap" allows the user to directly plot lines, text and filled polygons into an image, thus without taking a screen-shot (getframe).This function is also useful if you want to convert a few coordinates describing a region contour into a bitmap of the region.
Platforms: Matlab
| License: Shareware | Cost: $0.00 USD | Size: 10 KB | Download (41): Plot to Bitmap Download |
Added: April 14, 2013 | Visits: 586
I wrote this to plot some overlapping data sets with there means and regions of +/- std deviations shown. It could be used for other purposes though.
Platforms: Matlab
| License: Freeware | Size: 10 KB | Download (47): Plot Overlapping Regions With Lines Download |
Released: July 22, 2011
|
Added: September 08, 2011 | Visits: 794
 arcadiaCharts creates attractive, interactive 2D and 3D JavaScript and GWT charts which run natively in all browsers without plugins (no flash required). Supported chart types are: line, area, pie, donut (doughnut), bar, column, scatter, xy, logarithmic scale charts, time plot. Uses AJAX and...
Platforms: OS/2, Windows, Mac, *nix, Windows CE, Pocket PC, Other,Android,BlackBerry,iPhone,iPod,iTouch,Palm,Palm OS 6.0,Handheld/Mobile Other,Java
| License: Shareware | Cost: $139.00 USD | Size: 9.57 MB | Download (101): ArcadiaCharts Download |
Added: September 10, 2013 | Visits: 473
Plot Digitizer is a Java program used to digitize scanned plots of functional data. Often data is found presented in reports and references as functional X-Y type scatter or line plots. In order to use this data, it must somehow be digitized. This program will allow you to take a scanned image of...
Platforms: Mac
| License: Freeware | Size: 1.16 MB | Download (46): Plot Digitizer Download |
Added: August 06, 2013 | Visits: 483
Simple PLOT , ZOOM and FFT for various oscilloscpope, Simulink or Matlab data formats No input parameter is required to start the program. Input data are selected and loaded from the top-level (start) GUI --->> GetData_vxx.fig.Implements the selection of a workspace variable generated in the...
Platforms: Matlab
| License: Shareware | Cost: $0.00 USD | Size: 112.64 KB | Download (41): Simple Plot, Zoom and FFT GUI Download |
Added: June 16, 2013 | Visits: 519
CYL3D(Zin,theta_min,theta_max,Rho,H,meshscale) plots the 3D profile Zin as a mesh plot on a cylindrical surface of radius Rho, with mesh size determined by meshscale, for equally spacedangles between theta_min and theta_max. H is the cylinder height. CYL3D(Zin,...,meshscale,plotspec) plots the 3D...
Platforms: Matlab
| License: Shareware | Cost: $0.00 USD | Size: 399.36 KB | Download (55): 3D Plot on a Cylindrical Surface Download |
Added: July 28, 2013 | Visits: 454
This Function takes the current Matlab figure (gcf) and paste it into an existing Excel File.Example:plot(1:10)xlsPasteTo('Book2','Sheet1',300, 400,'D6')
Platforms: Matlab
| License: Shareware | Cost: $0.00 USD | Size: 102.4 KB | Download (42): Paste a Matlab figure to Excel Download |
Added: November 22, 2006 | Visits: 4.578
 Rt-Plot is a tool to generate Cartesian X/Y-plots from scientific data. You can enter and calculate tabular data. View the changing graphs, including linear and non linear regression, interpolation, differentiation and integration, during entering. Rt-Plot enables you to create plots fast and...
Platforms: Windows
| License: Shareware | Cost: $50.00 USD | Size: 5.56 MB | Download (195): Rt-Plot Download |
Released: August 24, 2012
|
Added: August 24, 2012 | Visits: 555
 Coulson Plot Generator application creates a multiple pie diagram, for comparing subunit occupancy across a range of entities. Numbers of pies, segments, labels and colours are customisable. Creates an editable PDF from a comma separated text file.
Platforms: Windows, Mac, Solaris, Linux
| License: Freeware | Size: 150.49 KB | Download (47): Coulson Plot Generator Download |