


Abortion Graphs software
Abortion Graphs
Added: April 25, 2013 | Visits: 432
 A very easy symbolic method for reduction of block diagrams or signal flow graphs with Matlab is presented. The method can be applied to every kind of diagram and it is possible to obtain in one stage all transfer functions for a given input. The method is validated with some examples, including...
Platforms: Matlab
| License: Shareware | Cost: $0.00 USD | Size: 122.88 KB | Download (44): Symbolic reduction of block diagrams and signal flow graphs Download |
Added: July 08, 2013 | Visits: 413
The note describes a simple m-file for digitizing graphs in the form of bitmap images using the Matlab ginput mouse pointer.Axes are allowed to be skewed, as well as linear and/or logarithmic.
Platforms: Matlab
| License: Shareware | Cost: $0.00 USD | Size: 61.44 KB | Download (48): Digitizing Graphs Download |
Added: March 26, 2013 | Visits: 481
The SumProductLab provides a set of basic factor nodes for building up a factor graph. One can try out ideas by instantiating the necessary constraint nodes, connecting them up, and giving some evidence. The sum-product (or belief propagation) algorithm will compute the message to each node in...
Platforms: Matlab
| License: Shareware | Cost: $0.00 USD | Size: 829.44 KB | Download (45): SumProductLab for Factor Graphs Download |
Added: June 29, 2013 | Visits: 355
For analysing measurements (or simulations) it is often necessary to plot different graphs from an array of data. Some graphs have one line, other have more.PLOTMAT is a function to do this. Given an array of data, and an array for which columns have to be plotted in which graphs, the graphs are...
Platforms: Matlab
| License: Shareware | Cost: $0.00 USD | Size: 10 KB | Download (39): Plot different graphs at once Download |
Added: January 01, 2006 | Visits: 7.922
 3D Grapher is a feature-rich yet easy-to-use graph plotting and data visualization software suitable for students, engineers and everybody who needs to work with 2D and 3D graphs. With 3D Grapher you can easily plot the equation and table-based graphs, zoom them, rotate, view at any angle and...
Platforms: Windows
| License: Shareware | Cost: $24.95 USD | Size: 728 KB | Download (936): 3D Grapher Download |
Released: March 09, 2009
|
Added: August 15, 2014 | Visits: 6.348
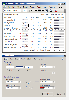
 Powerful but easy-to-use graphing, curve fitting and calculating software. Graphs Cartesian (Y(x) and X(y)), polar and parametric functions, graphs of tables, equations (implicit functions), inequalities and slope fields. Up to 100 graphs in one window. Calculus features: regression analysis,...
Platforms: Windows
| License: Shareware | Cost: $29.95 USD | Size: 1.38 MB | Download (698): Advanced Grapher Download |
Released: October 01, 2002
|
Added: June 20, 2006 | Visits: 5.797
 DigitizeIt digitizes scanned graphs. Graphs can be loaded in nearly all common image formats (incl. gif,tiff,jpeg,bmp,png) or pasted from the clipboard . Digitizing of line and scatter plots occurs automatically, manual digitizing is also possible. Data values are transformed to a specified axes...
Platforms: Windows, Mac, *nix
| License: Shareware | Cost: $39.00 USD | Size: 8.61 MB | Download (684): DigitizeIt Download |
Added: April 04, 2006 | Visits: 7.190
TaskMeter lets you put your CPU usage graph right on your taskbar. You can also measure a wide variety of other things, including disk access, network access, context switches, memory usage, and many more. Anything you can monitor in performance monitor (perfmon), you can monitor in TaskMeter....
Platforms: Windows
| License: Shareware | Cost: $15.00 USD | Size: 1000 KB | Download (401): TaskMeter Download |
Released: January 07, 2003
|
Added: November 22, 2006 | Visits: 3.260
 Web Enabled solution for creating Stacked Horizontal Charts & Graphs. Versatile components for web authors and developers to easily build and publish dynamic and interactive bar graphs.
Database Access Methods (Direct Data Binding and Multi-Tier)
Template Scripts and Implementations (ASP,...
Web Enabled solution for creating Stacked Horizontal Charts & Graphs. Versatile components for web authors and developers to easily build and publish dynamic and interactive bar graphs.
Database Access Methods (Direct Data Binding and Multi-Tier)
Template Scripts and Implementations (ASP,...
Platforms: DOS, Windows, Mac, *nix, Windows CE
| License: Shareware | Cost: $49.95 USD | Size: 259 KB | Download (716): 3D Stacked Horizontal Bar Graph Software Download |
Released: August 01, 2006
|
Added: November 06, 2006 | Visits: 4.848
 EasyFit allows to easily and quickly select the probability distribution which best fits to data, reducing your analysis times by 70-95% over manual methods. It includes numerous features designed to save you time, prevent analysis errors, and help you make better decisions.
An integrated...
EasyFit allows to easily and quickly select the probability distribution which best fits to data, reducing your analysis times by 70-95% over manual methods. It includes numerous features designed to save you time, prevent analysis errors, and help you make better decisions.
An integrated...
Platforms: Windows
| License: Shareware | Cost: $299.00 USD | Size: 2.08 MB | Download (315): EasyFit Download |
Released: January 12, 2005
|
Added: June 26, 2006 | Visits: 2.407
 Archim is a program for drawing the graphs of all kinds of functions. You can define a graph explicitly and parametrically, in polar and spherical coordinates, on a plane and in space (surface). Archim will be useful for teachers and students, as well as for everyone who is interested min...
Platforms: Windows
| License: Shareware | Cost: $25.00 USD | Size: 648 KB | Download (161): Archim Download |
Released: October 20, 2006
|
Added: November 17, 2006 | Visits: 3.414
 MicroCharts delivers an intuitive Excel add-in allowing you to create richer, more concise reports and dashboards with more information per square inch. Using the latest techniques in dashboard reporting, MicroCharts helps you generate data-rich tables and graphs as small as the size of words....
Platforms: Windows
| License: Shareware | Cost: $49.00 USD | Size: 488 KB | Download (179): MicroCharts Download |
Released: December 07, 2009
|
Added: March 12, 2010 | Visits: 3.594
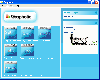
 Fun & Easy Time Tracking tool with record keeping timelog. Track time on projects, clients & tasks. Personalize it. Built in stopwatch with bill rates per task, task notes, fast task entry. Graphs & charts. Export to MS Excel or XML. PC & MAC. Convenient task stopwatch with pause & quick view of...
Platforms: Windows, Mac, *nix, Other
| License: Shareware | Cost: $10.00 USD | Size: 4.34 MB | Download (404): Vertabase Timer Download |
Released: August 27, 2008
|
Added: September 02, 2008 | Visits: 1.490
 Imagine a complete Graphing solution assisting you right from importing data and manipulating data, plotting graphs, customizing looks, saving and exporting your graphs as high quality images and producing dynamic reports of your data in a matter of a few easy steps.
Features:
- Data...
Imagine a complete Graphing solution assisting you right from importing data and manipulating data, plotting graphs, customizing looks, saving and exporting your graphs as high quality images and producing dynamic reports of your data in a matter of a few easy steps.
Features:
- Data...
Platforms: Windows
| License: Demo | Cost: $99.00 USD | Size: 8.12 MB | Download (134): Grapholic Download |
Released: June 03, 2016
|
Added: July 19, 2016 | Visits: 1.540
 Visual Complex is a graph software to create graph of complex function. 3D function graphs and 2D color maps can be created with this grapher. You can input complex functions in the form of w=f(z) (where z=x+yi) directly before creacting graphs. Graphs can be copied and saved in the format of...
Platforms: Windows, Windows 7, Windows Server
| License: Demo | Cost: $30.00 USD | Size: 1.86 MB | Download (155): Visual Complex Download |
Released: February 20, 2009
|
Added: March 03, 2009 | Visits: 2.535
 FusionCharts for Flex is a charting component for Adobe Flex solutions. It helps you create interactive charts and graphs in your Flex projects. The charts are powered by FusionCharts v3 framework - the industry leader in Adobe Flash Charting.
FusionCharts for Flex offers over 45 chart types...
FusionCharts for Flex is a charting component for Adobe Flex solutions. It helps you create interactive charts and graphs in your Flex projects. The charts are powered by FusionCharts v3 framework - the industry leader in Adobe Flash Charting.
FusionCharts for Flex offers over 45 chart types...
Platforms: Windows, Mac, *nix
| License: Shareware | Cost: $299.00 USD | Size: 14.49 MB | Download (216): FusionCharts for Flex Download |
Added: July 18, 2010 | Visits: 1.399
The Big Faceless Graph Library is a Java class library for creating graphs and charts. It is backed by a full 3D engine, allowing you to create shaded 3D pie, bar, and line graphs as GIF, PDF, PNG, or other image formats. Big Faceless Graph Library features include transparent backgrounds,...
Platforms: *nix
| License: Shareware | Cost: $800.00 USD | Size: 1.6 MB | Download (100): Big Faceless Graph Library Download |
Added: July 06, 2010 | Visits: 1.740
System Health Monitor for Linux is a handy python program that will setup your system to generate RRD Graphs of network interface traffic, system load, memory usage, disk space and inode usage and graphs of the number of running processes. System Health Monitor features a user-friendly...
Platforms: *nix
| License: Freeware | Size: 17.41 KB | Download (101): System Health Monitor Download |
Added: April 02, 2010 | Visits: 1.567
durep creates disk usage reports with bar graphs, allowing one to easily deduce which directories are using the most space. Although durep can produce text output similar to do, its real power lies in the ability to store reports in a file, which can then be viewed as a web page with the...
Platforms: *nix
| License: Freeware | Size: 13.31 KB | Download (137): durep Download |
Added: September 26, 2010 | Visits: 828
Serverstats is a simple tool for creating graphs using rrdtool. It does not have any features to manage the created rrd-files, so if you change anything you have to delete and recreate the files. There is also no frontend for managing your graphs and sources. Serverstats is designed to be...
Platforms: *nix
| License: Freeware | Size: 1.02 KB | Download (102): Serverstats Download |